Find out who's home with this early childhood animal chart activity!
Age recommendation: 3 – 7 years
Who’s home? The trees all around us are a habitat or home to many different animals. Learn about how a tree can provide shelter, food, and a place to play!
You can complete this animal chart activity by simply following the steps below, but if you'd like to add to the activity, we recommend you make it a story time with the book The Busy Tree by Jennifer Ward, illustrated by Lisa Falkenstern and published by Two Lions, an Amazon Publishing imprint. Get the book on Amazon.com here, or consider getting an e-book or checking it out from your local library if it's available!
If you want to keep an eye out for the animals you see in The Busy Tree, you can print out this pre-made chart by clicking here. You can also use this chart as a start instead of making your own but keep in mind you may not see all of these animals during your observations. We’ve left one column blank so if you see an animal neighbor who lives near you that isn’t in the book, you can still include them in your data!
Who are your tree-dwelling neighbors?
Lots of the animals who live in The Busy Tree are animals that we see here in Florida. Take some time to observe the outdoors through a window, in a backyard, or on a nature walk.
As you’re observing, collect data on what you see! As scientists, when we collect data we are gathering information about something so that we can better understand it. As you collect data on the animals that live in the trees near your home, you are learning more about your environment and the critters who share a space with you.
Materials For Your Animal Chart Activity:
- Paper
- Clipboard or something to lean and write against
- Marker, crayon, or pencil
- Straightedge like a ruler, the side of a book, or anything you have on hand
- Binoculars (optional)
- Magnifying glass (optional)

Directions:
STEP 1
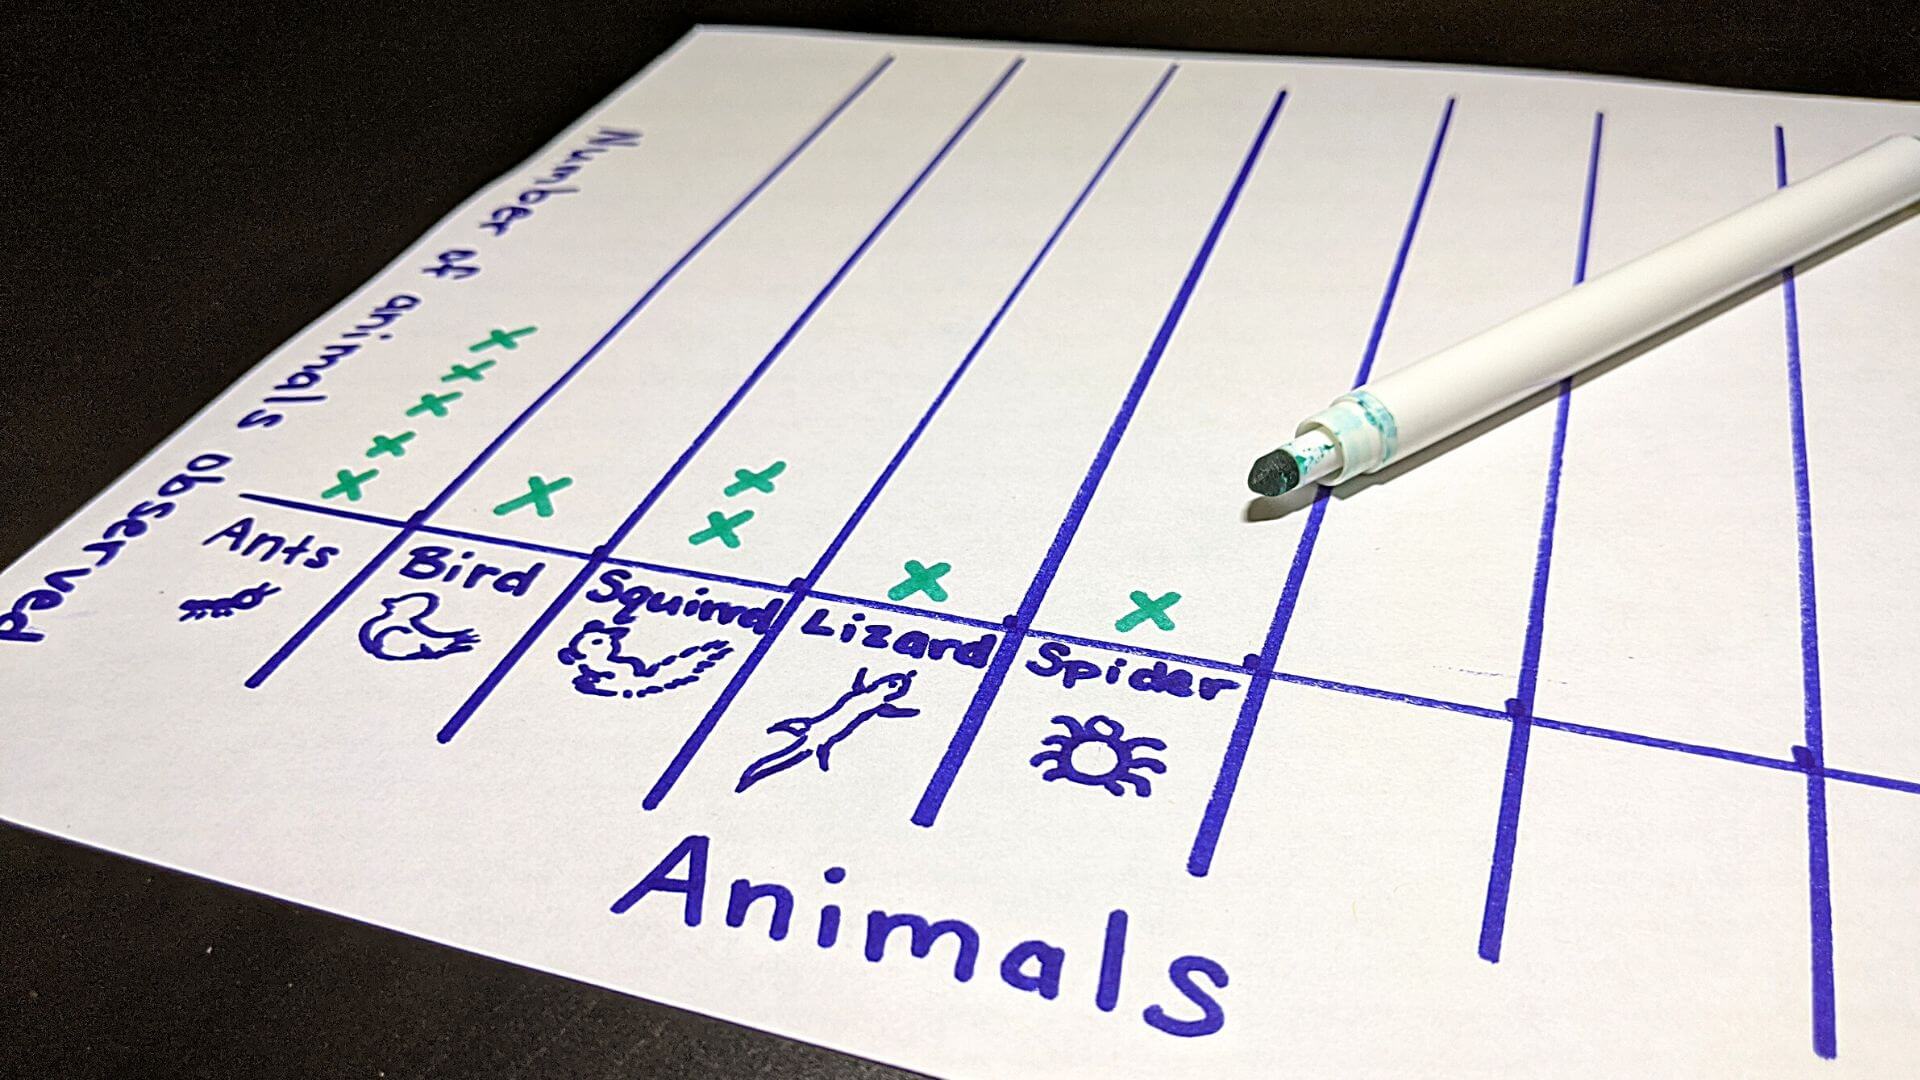
- Using your paper and writing utensil, create a simple chart. You can use your straightedge to help you make straight lines.
A chart is a way to keep track of information, this is one of the ways scientists collect data. In our chart we will keep track of which animals we see at the bottom, and how many of that animal we see in the top columns (the tall skinny space above the animal). Be sure to add the date and time you are collecting your observations!
STEP 2
- Attach your chart to a clipboard with your writing utensil and get ready to explore. Binoculars can help you see things that are far away (like up in a tree!) and magnifying glasses can help you see things that are small (like insects at the roots of a tree or on the tree’s bark). Bring binoculars and a magnifying glass if you have them. If not, you can still make amazing observations with just your eyes!

STEP 3
- You need to find a place around your home to observe. This could be in a yard, a nearby park, or out on a walk. Bring your supplies with you to start making observations!
Always ask a grown-up before going outside!
STEP 4
Pay attention to the animals you see around the trees near your home. When you see an animal, write the name of the animal or draw a picture at the bottom of your chart.

STEP 5
- Make one “x” in the column above an animal for each one you see. Only count an individual animal once! If you see the same squirrel again, don’t make another “x”. If you see a different squirrel, make an “x”. This will make our data more accurate!
STEP 6
- When you are done observing and collecting data, count how many of each animal you wrote down on your chart. Analyze or think about the information from your chart. Which animal did you see the most? Which animal did you see the least? Why might that be?

STEP 7
- This is an experiment that you can repeat. Some animals are more active during different times of day. Choose a different time of day to collect data from your observations, then compare and contrast the data you have collected. Did you notice more of a certain animal during the evening than during the day? If you repeat this experiment all year, you may notice different animals are busier during certain seasons.
STEP 8
- Enjoy getting to know your animal neighbors!

Be a citizen scientist!
You can become a citizen scientist when you use the data you collect while watching animals around your home to help real-life scientists with their projects! Check out the projects below to see how you can help.
Always ask a grown-up before visiting a new website and before posting anything online!
The Lost Ladybug Project
Website: http://www.lostladybug.org/
If you come across ladybugs during your observations, consider contributing to The Lost Ladybug Project. This project is investigating ladybug diversity and will help scientists better understand where all of the native ladybugs have gone as well as provide information for other insect species!
Project Noah
Website: https://www.projectnoah.org/
Share your observations with pictures and notes through Project Noah. Project Noah is a place where people like you can help keep track of wildlife by sharing what you see! Researchers can then use your observations to collect ecological data (that’s information about how living things depend on one another).
iNaturalist
Website: https://www.inaturalist.org/
Citizen scientists all over the world observe animals and plants just like you are in our activity! You can share your observations on iNaturalist with others who love nature. The data that you and others share can be used by scientists globally (that means all over the world!) to help them with their projects.
OSC At Home Emails
Get a round up of our latest activities and ideas delivered straight to your inbox so you don't miss a thing!
Find out when we release new resources by following us on social media!
Follow us on social media for even more science fun including fun facts, games, behind-the-scenes photos, and more!

![]()
![]()
![]()
Support OSC At Home
In these ever-changing times, it is our pleasure to adapt quality Orlando Science Center experiences to engage with everyone while they are safe at home. Please consider supporting our operating fund to ensure we can continue developing resources today and well into the future. Thank you for your generosity and support!